
Initiation Report: lululemon
Category leadership enabled by a differentiated go-to-market approach

I have long been an admirer or lululemon’s business. In fact, I bought into the name in 2013 and sold it for a modest profit in 2018 after I grew impatient with the executive turnover at the company (3 CEOs in 5 years). This turned out to be a terrible mistake as the stock appreciated more than 6x from the price I sold it at (roughly US$60/share).
Last year gave me an opportunity to get back in the name during Q2 and Q3. What follows is my thought process and analysis that led me to that decision.
Executive Summary
lululemon athletica (NASDAQ:LULU) is a world-leading designer and retailer of high-end, athletic apparel for a variety of segments. The company has adopted a differentiated business model based on a direct-to-consumer (“D2C”) retail channel that employs a local, community-based approach to brand development and customer engagement, resulting in consistently superior financial performance relative to competitors.
We recommend initiating a position in LULU as current prices ($250-260/share) are estimated to be a discount to fair value of 25-60%, leading to expected compound annual returns of 14-40% over the next five years. We believe the 50% decline in the company’s stock price from 52-week highs is an overreaction to the slowdown in the US women’s category. In our view, short-term issues arising from product assortment are mitigated by: 1) a capable management team that has achieved its long-term targets in the past, 2) LULU’s D2C channel that provides a rapid feedback loop on product assortment, 3) material growth opportunities in international markets, and 4) continued white space in the US market based on brand penetration rates.
Competitive Moat
LULU designs and sells athletic apparel manufactured by third parties. The company originally focused on women’s yoga attire, but has since expanded into running, training, accessories, tennis, and men’s categories, among others. LULU has positioned itself as a premium player based on superior design, functionality, and fabrics, and has combined this product positioning with a D2C omni-channel retail model that allows the company to engage directly with its customers, while also capturing the retail portion of the value chain. In comparison, competitors in the athletic apparel segment generate the majority of their revenues from wholesale channels. Wholesale revenues represent anywhere from 56% to 75% of revenues for competitors like Nike, Under Armour, adidas, and Puma.
As a result of LULU’s business model, the company has taken a community-based approach to developing the brand in local contexts. The company is thus able to enter new markets supported by grassroots, bottom-up engagement, while creating more durable relationships with its customers. As a result, LULU is subsequently able to accelerate its product development process, as customer feedback at the store level is fed back directly to the company’s design team.
LULU’s most direct competitor is Nike. In comparison to LULU, Nike’s business is primarily driven by its wholesale channel, where it sells products to retailers that in turn, mark-up Nike’s products and sell to their customers. Measured at the retail level, Nike’s D2C segment accounts for just over 30% of FY2024 revenues. In terms of store count, Nike has roughly 300 stores in the US region, compared to over 400 for LULU, and over 600 stores internationally, compared to less than 300 for LULU. Given Nike’s business model, its reported revenues are understated in comparison to LULU’s retail level revenues. For example, Nike generated $21.5 billion in revenues in FY2024 from D2C sales. However, if these products had been sold to wholesale customers, revenues would have been only $13 billion, implying a 65% mark-up at the retail level. Applying this 65% mark-up to Nike’s wholesale-equivalent revenues suggests $67.8 billion of revenues at the retail level, compared to $9.6 billion for LULU during the same period. Based on this comparison with Nike, we conclude that LULU still has significant whitespace to expand its business, as measured by retail level sales, and by international store count.
Strategy
Currently, there are two major, global trends that are supportive of LULU’s long-term position. These trends are: 1) increasing interest and spending in health and wellness, and 2) the loneliness epidemic and resulting demand for community and belonging.
Health and wellness
According to McKinsey, more than 80 percent of US consumers consider wellness to be a top or important priority, with similar responses reported in the UK (73%), and China (87%). Beyond the headline figures, almost 60% of US survey respondents are increasing the priority of wellness in their lives, while younger demographics increasingly represent the largest proportion of spending in the category. In addition, not only are these age groups spending more on health and wellness, more than half of Gen-Z consumers consider fitness to be a very high priority, versus 40% of the overall market, suggesting that consumers will continue to focus their spending on categories that LULU is currently serving.[1] We also expect that as emerging markets transition to higher consumer incomes, these markets will follow a similar path as developed economies and devote a higher amount of consumer spending on products that improve their quality of life. This tailwind in international markets will provide support for LULU’s focus on ex-US expansion.
Loneliness, community, and belonging
It’s increasingly being acknowledged that loneliness is a widespread experience in developed economies, and that there are negative health implications for people that live in a chronic state of loneliness.[2] Our view is that increasing rates of loneliness reflect the breakdown in acceptance of traditional sources of social connection, particularly in western, liberal democracies. In the wake of this breakdown, there is a large and growing need for people to find new sources of belonging, which we believe will increasingly come from high priority interests. Specifically, we believe that fitness activities will increasingly be an avenue that people look towards to build relationships and find connection; in the McKinsey study noted earlier, half of survey respondents stated that fitness was a core part of their identity. LULU is thus extremely well positioned in relation to this secular trend, given their focus on building communities around their retail locations, based on a shared passion for fitness and wellness. These stores not only provide LULU apparel to customers, but offer fitness and social events that bring customers together in an experience that adds value beyond the products sold.
Beyond the two major trends that LULU’s strategy and business model are aligned with, we believe that the company is still in a relatively early phase of market penetration as measured by what management refers to as “unaided brand awareness”. As per the figures below from the 2022 investor day, there is still a sizeable amount of whitespace available for the company to expand into, even when including the US market.

If we were to assume that management was overestimating the company’s growth potential and double the unaided brand awareness figures provided above, there is still substantial room to grow as the major sports brands (Nike, adidas, Puma) have unaided brand awareness in the US that exceeds 90%. The only market that could be deemed mature given this conservative framework would be Canada.
Financial Performance and Benchmarking
The company’s differentiated retail business model has consistently produced superior financial performance when compared to peers. LULU has higher long-term revenues growth rates, higher gross and EBIT margins, and higher returns on capital. All these achievements have been accomplished despite LULU operating at a lower level of scale relative to its peers. We summarize the financial performance of LULU and its competitors in the following table:
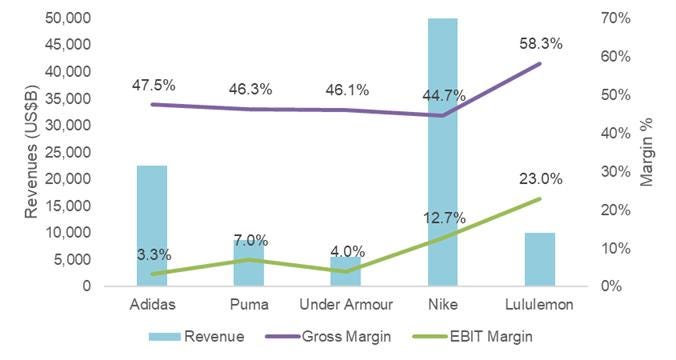
As noted above, LULU’s gross margin is more than 1,000bps higher than all of its peers, and more than 1,300bps higher than Nike, while operating at a quarter of Nike’s revenues (or less than 15% of retail level revenues for Nike). On an EBIT basis, LULU’s margin is 10 percentage points higher than Nike’s, and the advantage extends to free cash flow margins as well. Over the past 5 years, LULU has grown its revenues by 24% and EBIT by 26% per year on a compound basis, while Nike has grown these metrics by roughly 6% and 7%, respectively, over the same period.
LULU has no debt outstanding, and holds over $2 billion of cash-on hand, as at the end of FY 2024.
Valuation & Expected Returns
Our starting point for developing a valuation estimate for LULU is the company’s investor day presentation dated April 20, 2022. In this material, management laid out a long-term target of $12.5 billion in revenues by FY2027. We have used this figure as our base case given management’s prior success in achieving its stated targets, which we have analyzed in the Management and Execution Capabilities section of this report. With the company’s stated revenue goal in mind, we drove growth primarily through new store openings and same-store-sales (“SSS”) growth in China and Rest of World markets, while store count and SSS growth in Americas increased by 2% each during the same period. We forecasted gross margins to stay flat at 58.4% over the forecast period, while the business benefits from operating leverage as it grows.
The net result is a base case with a 15% revenue CAGR to FY2027, and EBIT CAGR of 20% over the same period due to EBIT margin expansion from 22.9% in 2023 to 27.4%. We forecast growth to slow after 2027, with a revenue CAGR of ~10% to the end of the forecast period and LULU’s EBIT margin reaching 30% in the terminal year. We note that a terminal EBIT margin of 30% with gross margins of ~60% compares with 40% and 70% respectively for LVMH’s fashion and leather goods business, another premium, vertically integrated retail company, that we see as a reasonable sanity check for our operating assumptions.
In comparison to the base case, our weak case assumes the company does not reach it’s 5-year revenue target ending in 2027, leading to 5-year revenue and EBIT CAGRs of 4.6% and 2.2% to 2029. The forecasted deterioration in EBIT margin to 20% is driven by declining gross margins and rising investment in SG&A in response to competition. At the same time, we forecast CapEx as a percentage of revenue to decline in the weak case as the company reduces the pace of store growth.
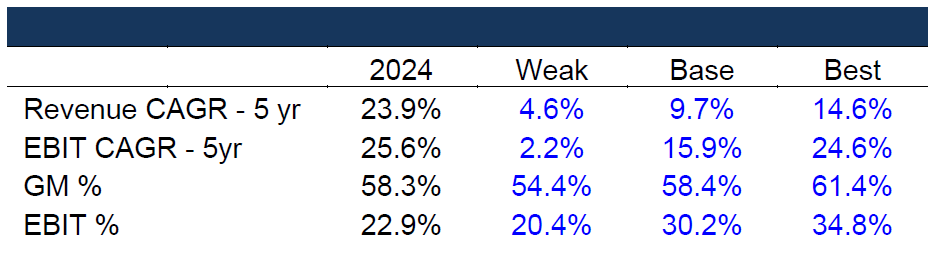
Our best case assumes a long-term revenue and EBIT CAGR of ~15%, and 25% as gross margins expand by 310bps and the company achieves greater operating leverage with its SG&A spend, leading to EBIT margin expansion to 35%. Below is a table summarizing our model forecasts over the next 5 years compared to the same metrics as at the end of the most recent fiscal year (2024). As noted below, revenue and EBIT CAGRs are lower than the latest 5-year period in all cases.
Our estimate of intrinsic value is driven by applying a multiple on terminal year EBIT in our forecast, then discounting that value back to today along with the forecast period cash flows. Our discount to fair value estimate of 25-60% is based on a terminal multiple of 10 – 20x EBIT. For context, over the past 10 years, LULU has traded between 15 and 60x EBIT, and most consistently within a range of 20 – 30x. At the time of writing, the company is trading at 14x 2024 reported EBIT.
Using the same assumptions and business cases, we have also estimated the expected value of LULU at the end of the forecast period to determine a range of returns over the holding period. Our base case combined with a 20x EBIT multiple on terminal earnings implies a cash-on-cash return of 3.2x or roughly 30% per year over 5 years. Our range of expected returns is summarized in the following table:
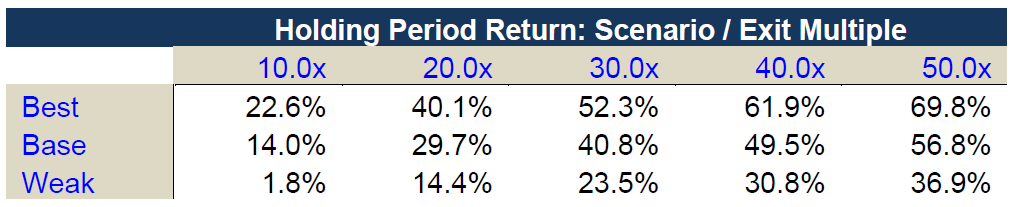
We believe the most likely return is between 30-40%, given the base case and historical valuation ranges. We note that the expected return at current prices is highly asymmetric, as even a worst-case scenario involving a significant slowdown in revenue growth, margin deterioration, and a multiple de-rate implies no loss of capital.
Lastly, we summarize the components of return for the base case forecast and an exit multiple of 20x EBIT:
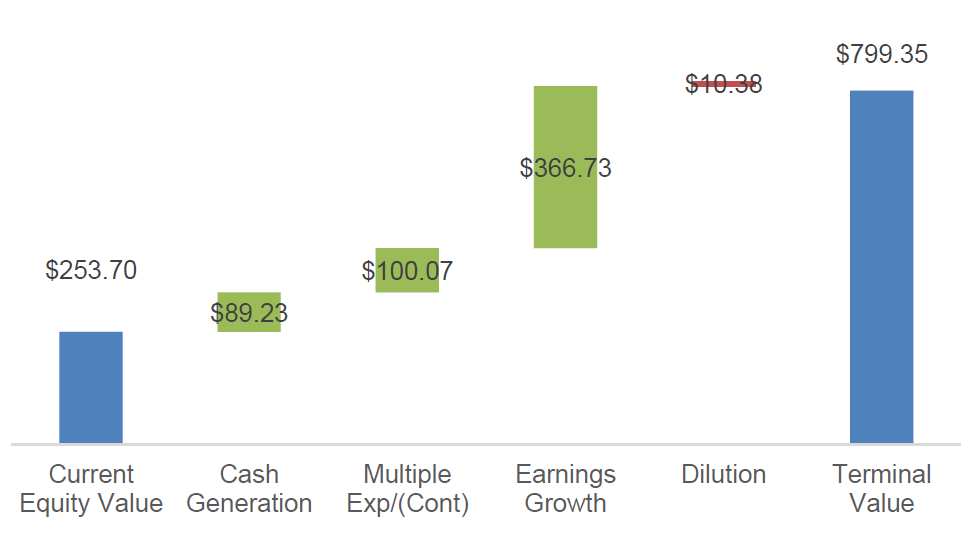
As we observe in the prior table, the largest component of expected return is the earnings growth forecasted for LULU. Post-investment monitoring will therefore focus on any acceleration or deceleration of LULU’s earnings growth rate while contextualizing these figures with changes to the company’s core business model, attempts by competitors to replicate said model, or relative rates of market penetration.
Management and Execution Capabilities
Given our investment returns depend on management’s forecast as outlined in its latest investor day, we devoted our attention to evaluating management’s track record in achieving previously announced external targets. Fortunately, the company hosted an investor day in 2019, which outlined management’s goals for the subsequent three years. Our summary of these targets and the actual result is summarized below:
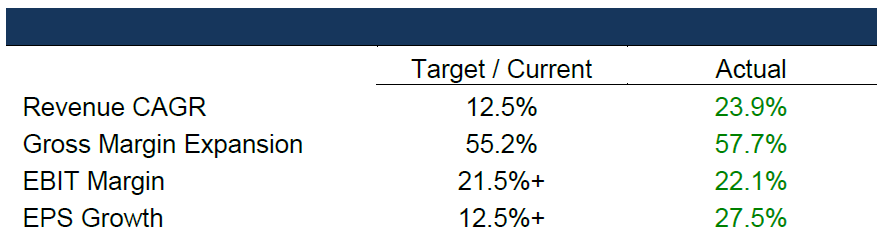
From the above table, we see that management met or exceeded all of the company’s targets from the 2019 investor day, giving us confidence in management’s latest round of long-term targets. Additionally, management has achieved short-term bonus payouts that were 200% of target over the past 3 years, further evidencing a high-performance team.
In terms of compensation structure, we note that 92% of the CEO’s compensation is performance based, with 60% of the total paid in long-term, equity-based incentives. For the remaining executives, 85% of compensation is performance based, with 56% of the total paid in equity-based incentives. The payouts for short-term cash incentives are determined by performance on revenue and operating income metrics, while PSUs are paid out on the achievement of Adjusted Operating Income targets. We consider both metrics to be aligned with shareholder objectives and the positioning of the company as a growth business.
Finally, just recently, the CEO made an open market purchase for approximately $1 million of LULU’s stock at a price of $260, suggesting conviction in the company’s prospects.
In short, we believe that the management team is highly capable with a proven track record, supported by a compensation structure that is well aligned with shareholder objectives, and with demonstrated personal conviction in the prospects of the company at current share price levels.
Governance and Shareholder Alignment
In aggregate, insiders (including board members), hold roughly 4% of total shares outstanding, with the majority of this amount (3% of total shares) held by Chip Wilson, the founder of LULU. However, Chip is no longer a board member that is actively involved with the company. We therefore see minimal economic alignment between the board and shareholders.
While current board members are required to hold 500% of their annual cash retainer in shares of the company, each board member receives an annual grant of equity that vests in one year and has 5 years from the start of the board position to meet the equity holding requirement. In other words, board members do not have any requirement to have “skin in the game” and can meet their ownership requirements through stock awards unconnected to the company’s operating or investor performance. Overall, we conclude that the board is poorly aligned with shareholders.
[1] The trends defining the $1.8 trillion global wellness market in 2024: https://www.mckinsey.com/industries/consumer-packaged-goods/our-insights/the-trends-defining-the-1-point-8-trillion-dollar-global-wellness-market-in-2024
[2] The loneliness epidemic threatens our health as well as our happiness: https://www.ft.com/content/5f712fe8-611c-405e-9098-09ccff95d6de
Thanks for the nice write up of LULU. One comment on the whitespace in relation to comps like NKE, etc. - personally, I am undercutting their potential to reach the comps' scale because of the lack of wholesaling. For example, I don't expect to see LULU products at a TJ Maxx or Ross which may limit the volumes. Honestly though I'd prefer to keep it that way to protect the brand and allow them to keep earning these very high returns on invested capital.
I think the mouse trap they have compared to comps set them up nicely to deliver attractive returns to shareholders if they are savvy with their capital allocation.